Monday, April 28, 2014

Magneto

In order to measure magnetic field strength, we included a magnetometer in the payload. We used Honeywell's HMC5883L triple-axis magnetometer (pictured below), available for about fifteen dollars at the sparkfun website.

We calibrated the sensor using localized, real-time Earth magnetic field data that is made public by the National Geophysical Data Center (NGDC) and National Oceanic and Atmospheric Association (NOAA). To calibrate and test the magnetometer, we took "actual" values from their website which provides accurate magnetic fields vectors by location.  The website is:
http://www.ngdc.noaa.gov/geomag-web
It turns out that the expected 'half a gauss' of magnetic field strength one typically encounters on Earth point primarily in the vertical direction. We calibrated the output corresponding to each (orthogonal and cartesian) magnetometer axis, so that when aligned vertically, it would agree with the actual vertical Earth magnetic field strength obtained from the aforementioned website. Physically and mathematically, we followed the same basic procedure we used to calibrate and test the accelerometer.
We formed a calibration curve for each (x, y, and z) magnetic field direction by interpolating from expected values corresponding to each analogRead output (summarized in the table below) from the sensor.

Actual Magnetic Field Strength (nT)
xRead
yRead
zRead
+50.6
    -382
    -546
    -421
-50.6
479
278
323

For each (x, y, z) direction, two points were used to form the following linear calibration curves which calculate magnetic field strength from the Arduino software's analogRead commands.



Temperature Sensor Testing


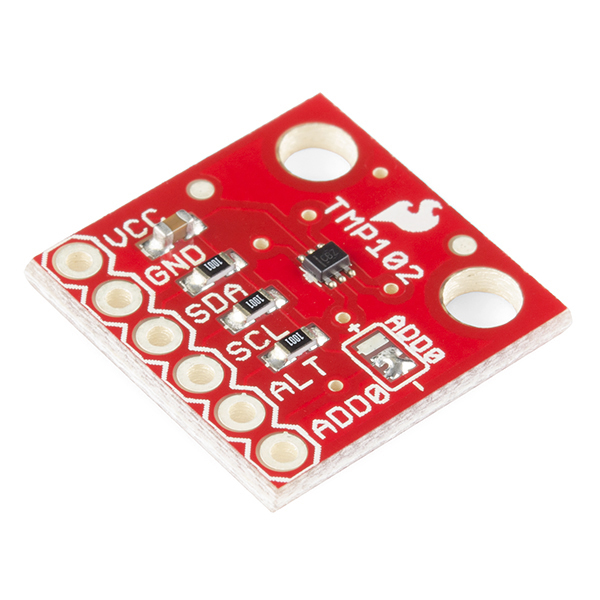
In order to measure atmospheric temperature, we included on our payload a digital temperature sensor, the TM102, which can be purchased using the following link: 
\https://www.sparkfun.com/products/11931
The TMP102 provides temperature measurements by calculating the difference in arrival time of a test signal through a wire exposed to some unknown temperature. This is compared to a standard, constant clock signal which isn't affected by temperature. 
A change in temperature tends to induce predictable changes in a material's electrical conductivity, or resistance. Since most metals exhibit greater resistances with increasing temperatures, the (change in) arrival time of a signal traveling through such a wire can be accurately matched to its temperature. This sensor uses diodes which have particularly large and linear temperature coefficients. Therefore, with a constant operating current, a change in temperature felt by the TMP102 (changing the resistance of the test wire) induces voltage differences read by specific analog inputs on the Arduino microcontroller. 
The manufacturer has published an operating range of -40 C to +125 C but we expected our payload to experience temperatures slightly lower than that. We tested the accuracy of the TMP102 down to -74 C. With the help of Mr. Larkin, we were able to use a freezer in the graduate labs of the Mark J. Science Complex at EMU. 


Seen above is the refrigerator in the lab, showing -74 C. The laptop on the left is connected to an arduino through USB. We wire-wrapped the TMP102 to that arduino using long wires which were thin enough to allow the refrigerator door to close and latch. We protected the sensor from potential condensation in the refrigerator with a small zip-lock bag.
The TMP102 sensor reacted faster than expected, reaching equilibrium with the refrigerator in under fifteen minutes. We defined that point by no reported change in temperature by the TMP102 for a duration of 10 to 15 seconds. By that time the change in temperature with time had settled to 0.01 C per second. 
We then tested the TMP102 in with a less powerful refrigerator in the same lab as well as at room temperature. The following table summarizes those results:

Measured Temperature (C)Actual Temperature (C)%-error
-75.0 -74.0 1.35
-17.9 -17.5 2.29
22.122.9 3.49

"Actual Temperature" was measured using an IR thermometer except in the coldest test, in which the temperature reported by the refrigerator was used.

The results show that we can depend on this temperature sensor to operate as expected, outside the published range with minimal %-error. 

Sunday, April 27, 2014

Flight Video Links

Weathered Warriors Part 1: https://www.youtube.com/watch?v=JPCuhRh7Urw
Weathered Warriors Part 2: https://www.youtube.com/watch?v=X6bR5eZBMv0
Weathered Warriors Part 3: https://www.youtube.com/watch?v=qvIiy5kTSAg
Weathered Warriors Part 4: https://www.youtube.com/watch?v=hOzmXxAkdu8

Pre-Flight Testing

            Before sending our payload out into the atmosphere to receive measurements, we had to make sure our data was going to be able to be sent to us via the Laird Aerocomm Radios, and our position was going to be displayed online via the Micro-Trak GPS System. As you have seen in our earlier posts, we have been successful in having our payload communicate with the computer via Aerocomm while in the lab, but we had yet to ensure all of our data would be sent over a long distance. So we set up our ground station in the yard in front of the Mark Jefferson Science Building, and had one of us walk around with the payload and Micro-Trak, while maintaining line of sight with the ground station. We found to our disappointment that the radios would only communicate within a distance of about thirty feet. The other group was having similar issues with their system, but after consulting with Dr. Pawlowski, we decided the loss in communication was most likely due to interference from all the nearby trees and buildings. We were able to get a satellite lock on the Micro-Trak, but the data wasn't being loaded onto the website. We figured this to be a momentary issue with the website and not with our device. We were also able to use this time to check over and finalize testing for all of our other devices on the payload. While the payload was within thirty feet, we were able to see all our data presented completely and organized, which let us know the data logger was working fine. Also, we saw we had an adequate number of satellites lock onto our GPS sensor in the payload, and all of our sensors were giving accurate measurements for our conditions. After checking all of these devices and concluding what we believed to be the causes of our Aerocomm and Micro-Trak issues, we decided that our payload was ready to be combined with the other balloon components and go for launch.

Accelerometer Sensor Testing

                We tested the ADXL335 accelerometer by first rotating it so that each axis would receive a value of 1g, 0g, and -1g for a given time. We then observed the analog read data saved on the data logger to see what values each axis was giving off, based on the g value they were receiving. Below are the analog read values we found for each g value, for each axis.

x Val
y Val
z Val
0g
339
339
347
+1g
406
402
412
-1g
270
265
279

                From here we then created three linear calibration equations to place into our code so we would receive g values instead of arbitrary analog read ones. The three equations are below.


              As you can see, the three linear equations will convert our analog data into multiples of g, which ensures that the data we collect will be accurate and usable for analysis.

Friday, April 25, 2014

Weather Balloon Flight

LAUNCH DAY!

            It’s been a long time coming, but we've finally built a working balloon and were ready to let it fly. This post will discuss the launch day events, launch, tracking, and recovery. The weather was great, not a cloud in the sky. The Weathered Warriors team started a little slow the morning of the launch, but that didn't stop us. The team made its way just South of Coldwater, Michigan where our flight simulation software predicted the best launch site. The team used the following website with our payload specifications and current weather predictions to model a simulated flight of our balloon: UM balloon sim.

            Upon reaching the launch site Adam began setting up the ground communication systems while Jason and Guy prepared the payloads for launch.  A final brief test of payload systems was carried out in the parking lot of an elementary school just south of Coldwater, MI. An initial test of the systems showed good results. The aerocomm was sending the sensor data clearly. A few minutes wait, a GPS lock was attained with about 9 satellites relaying data. The payload was shut off to conserve power until just before launch. Guy and Jason secured the payloads to each other using quick links and nylon string.

The Weathered Warriors’ balloon was the last of four to launch. With preparations made, all payloads were powered on and secured. The Microtrak was being picked up by our ground station and igating perfectly with aprs.fi. The cell tracker was responding with accurate GPS coordinates when prompted and the accutracking website had the location locked. The aerocomm system wasn’t relaying information however. The system had worked great in the parking lot, but not that the balloon was 50 yards away on the lawn of the elementary school the comms system had ceased to function. At this point, our balloon was almost inflated and we had no choice but to launch and hope the problem was just a line of sight issue. This turned out not to be the problem as the aerocomm system did not receive another transmission for the remainder of the day.

Immediately after the launch, we packed up and took off toward the predicted landing site. The cell tracker stopped responding to our texts for GPS coordinates once it lost cellular signal which occurred at about 10,000 ft. The Microtrak however did function and relayed an updated ping to our ground station every minute. Some signals were not received however we never went longer than five minutes at a time without receiving a new message. Below is a screen shot of the flight data which can be found at aprs.fi with the call sign KD8WZP.


The balloon popped somewhere over US-223 and reached a maximum measured altitude of 93,000 feet. The balloon landed on the northern side of Tecumseh, MI a few miles short of the prediction. We believe the parachute was tangle and only partially deployed during the decent. This faster decent caused the balloon to land short of the target area. All parts of the balloon were recovered except for the FTU which had been lost somewhere along the flight.

A final note to make about the recovery would be to say that when the balloon landed we were still a few miles away driving through the town of Tecumseh. Below 800 feet, we stopped receiving messages from the Microtrak. We think that this was due to a lack of line of sight with the Microtrak and our ground station in the car. We knew the general location of the landing site, but not the exact location. However at this point, the cell tracker had regained service and began responding to the several texts which were sent to it while in flight. The cell tracker was used to give us the exact GPS coordinates of the payload after it had landed. We used a google maps app on a cell phone to track down the payload on foot which made recovery a breeze. We found it almost immediately. Luckily the payload landed in an open field not more than 200 yards away from a road.   

Friday, March 28, 2014

Pressure Sensor Testing


We tested the MPX5100A pressure sensor by placing the device in the same room as an analogue barometer and reading both measurements, and by placing the device outside and looking up the barometric pressure of our area online. Our results are below.
Expected
Measured
%-error
Weather.com
100.6 kPa
100.0 kPa
0.6 %
Classroom Barometer
94.8 kPa
98.8 kPa
4.2 %
We feel that the percent difference is higher when compared to the analogue barometer because the analogue barometer is old and probably hasn’t been calibrated in a while. We are still confident in our results to send the sensor up with our payload

MicroTrack

                In order to be able to find the payload after it has completed its flight, we will be using a Micro-Trak GPS system, shown below.

The Micro-Trak AIO takes a GPS signal and sends it to APRS receiving towers, which then send the data online where we can see its position. To configure the Micro-Trak, all we had to do was plug it into the USB port on a computer and open up the TinyTrak3 computer program.


We did not have to do any further configuring on the Micro-Trak, but did use the software to find the devices call sign so it could be used to find the GPS signal online. So once we had the call sign, we took the Micro-Trak outside with a computer, turned on the device, then searched for the signal using the website aprs.fi. The signal was found almost immediately and showed us to be right where we were. Below is a picture of the website showing our signal location.


Thursday, March 27, 2014

Flight Termination

                Team Weathered Warriors will be using a flight termination unit to ensure the flight of our weather balloon ends when we need it to. The primary cut down system for the flight is the balloon’s expansion as the altitude rises.  As altitude increases the air density will decrease, this will cause the balloon to expand in volume. Upon reaching our target altitude of 100,000 feet, the balloon will expand past its maximum volume and pop due to the pressure difference between the inside and outside of the balloon. If this system fails for any reason, we’ll be using a secondary flight termination unit. This is also in accordance with FAA regulations.

                The flight termination unit (FTU) that we’ve built and tested will use current running through a high resistance nichrome wire. The current will cause the wire to heat up dramatically. This nichrome wire will be wrapped around the kite string which connects the payload to the balloon. The heat will sever the kite string and the payload will fall back to Earth.

                To do this, we’ve employed a second arduino and a relay circuit. The arduino is programmed to send a current through a pin after a specific amount of time has passed. For this flight, the ascent time will be about 90 minutes.  To test this system we built a circuit which used a relay to light an LED with a 9 volt battery. After the secondary arduino had been powered for 10 seconds, the relay switch was flipped and the secondary was closed. This allowed the LED to light up using the relay circuit battery only. Once this had been tested, the LED was replaced with a small segment of nichrome wire. The relay circuit worked as anticipated and the 9 volt battery caused the wire to heat up to high enough temperature to melt the kite string we will be using in our flight. 

Tuesday, March 25, 2014

Aerocomm AC4490LR-1000M

                The communications system our balloon utilizes are the Laird Technologies Aerocomm AC4490LR-1000M radios. The radios operate on 900MHz frequencies and have a max operating range of 40 miles with a clear line of sight. The radios also require a low amount of power to operate at their full potential. The radios are small and lightweight. These traits make them ideal for our high altitude weather balloon. Since the radios use amateur bands of radio frequencies to operate, two of our group members have obtained our amateur radio licenses so that we may legally use the radios for our project.

                The group is using a AC4490 developer's kit to make the configuration of the radios easier. The software that comes with the dev kit is designed for easy configuration of the radios and allows the users to set them up in any way you'd need. Our set up is fairly simple. A radio (the client) will be wired to the PCB in our payload and an antenna connected to the radio will poke its way through the payload wall which should provide an easy line of site to the ground station. The ground station will consist of our other radio (the server) connected to a laptop which will be receiving signals from the balloon. The picture below shows the server radio wired to a board which connects to our ground station laptop via USB cable.


                The software which Laird has provided as a configuration utility can be rather clunky at times. The program is susceptible to random freezing and will often decide to stop reading the radios altogether without actually freezing up. A restart of the program or computer we were using the software on would fix these issues. The radios our team was using had never been written to before. The radios come factory set with a 56700 baud rate. The radios had to be read with this rate initially and then written to our baud rate of 9600. This little fact that isn't in the manual took a while to solve.

                Despite these hiccups the software allowed us to configure one radio as the client and one as the server as well as address them to each other. Through several trial and error attempts we were able to use the manual to correctly wire the radio to our arduino and send a test message of "Hello!" several hundred times. From here,  it was a matter of wiring the radio in with the rest of our sensors and main arduino to see if the radios sent all the data we needed them to.

                This caused a few unforeseen problems. The pin which activates the long range mode, pin 11, of the radio needs exactly 3.3V to function. The arduino wasn't providing pin 11 with enough potential when all the other sensors were connected. We got around this by powering this specific pin separately using an external power source and a voltage divider. The nice thing about the potentiometer being used as a voltage divider is that it is adjustable. So if things suddenly change on the day of launch and we need more or less voltage, we can simply change it. The code for our sensors took a little touching up to get the right information and timing to come across through the radio, but we have configured these radios so that the balloon payload will send the measurements to the ground station in real time.